Visualizing Success: Data Visualization in the Big Data Era
In the ever-evolving digital landscape, the volume and complexity of data continue to grow exponentially, making it overwhelming for enterprises to navigate. However, amidst the chaos lies a powerful tool: data visualisation. In this blog, we'll explore the critical role of data visualisation in the age of big data, focusing on how it can help enterprises in various sectors make sense of complex data sets and drive informed decision-making. So, how can harnessing the power of visuals transform your approach to data analysis?
Unravelling Complex Insights: The Power of Visualisation
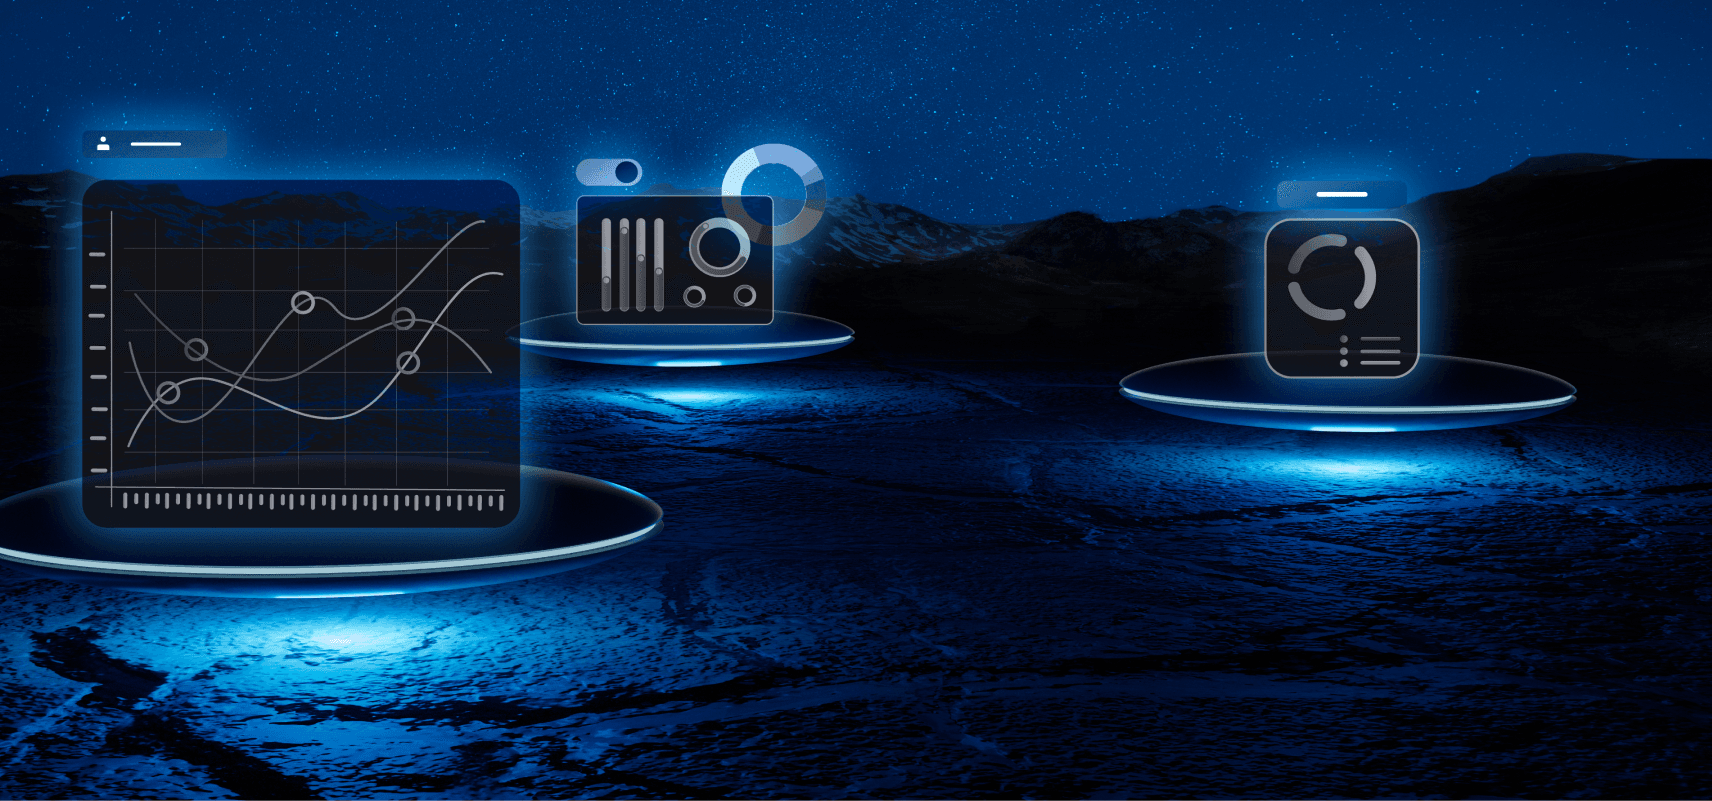
Data visualisation is not just about aesthetics; it is about converting raw data into actionable insights. By using intuitive charts, graphs, and dashboards, businesses can easily understand vast amounts of information visually. Whether it is analysing customer behaviour in retail, monitoring financial trends in banking, tracking patient outcomes in healthcare, or visualising public sector data in government, data visualisation helps decision-makers to comprehend complex patterns and trends quickly.
Enhancing Customer Experiences: From Fashion to Environment
In the fast-paced world of retail, understanding customer preferences and market trends is crucial for success. Data visualisation enables retailers to visualise sales trends, identify popular products, and tailor marketing strategies accordingly. Similarly, visualising audience demographics and consumption patterns in the entertainment industry can inform content creation and distribution strategies, enhancing customer engagement and driving revenue growth.
Optimising Financial Strategies: Insights for Banking and Finance
Data visualisation is a critical aspect of risk management, investment analysis, and customer relationship management in the banking and finance industry. Financial institutions can make data-driven decisions more quickly and confidently by visualising market trends, portfolio performance, and customer satisfaction metrics. Whether detecting fraudulent transactions, predicting market trends, or optimising investment portfolios, data visualisation provides invaluable insights for driving business growth and mitigating risks.
Improving Patient Outcomes: The Role of Visualization in Healthcare
Effective data visualisation plays a crucial role in healthcare. It enables healthcare providers to visualise patient data, medical records, and treatment outcomes, which helps them identify patterns, diagnose diseases, and tailor treatment plans for individual patients. With the help of data visualisation, healthcare professionals can track disease outbreaks, monitor population health trends, and deliver better care, which ultimately leads to improved outcomes and saves lives.
Informing Policy Decisions: Harnessing Data Visualization in Government
In the public sector, data visualisation is essential for informing policy decisions, allocating resources, and enhancing transparency. Visualising government data on demographics, infrastructure, and public services allows policymakers to identify areas of need, allocate funding effectively, and measure the impact of policies. From visualising crime trends to mapping demographic shifts, data visualisation enables governments to address societal challenges and improve the lives of citizens.
Conclusion: Partnering for Data-driven Success
In conclusion, data visualisation is a powerful tool for enterprises across sectors, enabling them to unlock the full potential of their data and drive business success. By partnering with us, enterprises can gain access to cutting-edge data visualisation tools and expertise tailored to their specific needs. Together, we can harness the power of data visualisation to navigate the complexities of big data, make informed decisions, and drive innovation across industries.
How can data visualisation help your enterprise unlock insights and drive success? Reach out to us today to explore how we can help you leverage the power of data visualisation for your business.
For more information about Healthcare And Data Science visit here :
https://digitalbackoffice.co.u....k/posts/data-visuali


Sleep naar de juiste positie
Digital Back Office
@Digitalbackoffice
Respect!


Kommentar
Delen
AWS Consultants
Transform your business with production-ready AI solutions. Expert AI consulting, RAG implementation, data engineering, and ML services trusted by global enterprises. Get measurable ROI in 6 months.
visit here: https://digitalbackoffice.co.uk/
Respect!
Kommentar
Delen
Respect!
Kommentar
Delen
Respect!
Kommentar
Delen
Laad meer berichten